Incident mapping & GIS

See your whole district on one map.

Every call colored by type, every station and response area, every inspection and hydrant. Reskyr places them from the addresses you already enter, so the map fills in on its own. No GIS staff, no extra license.

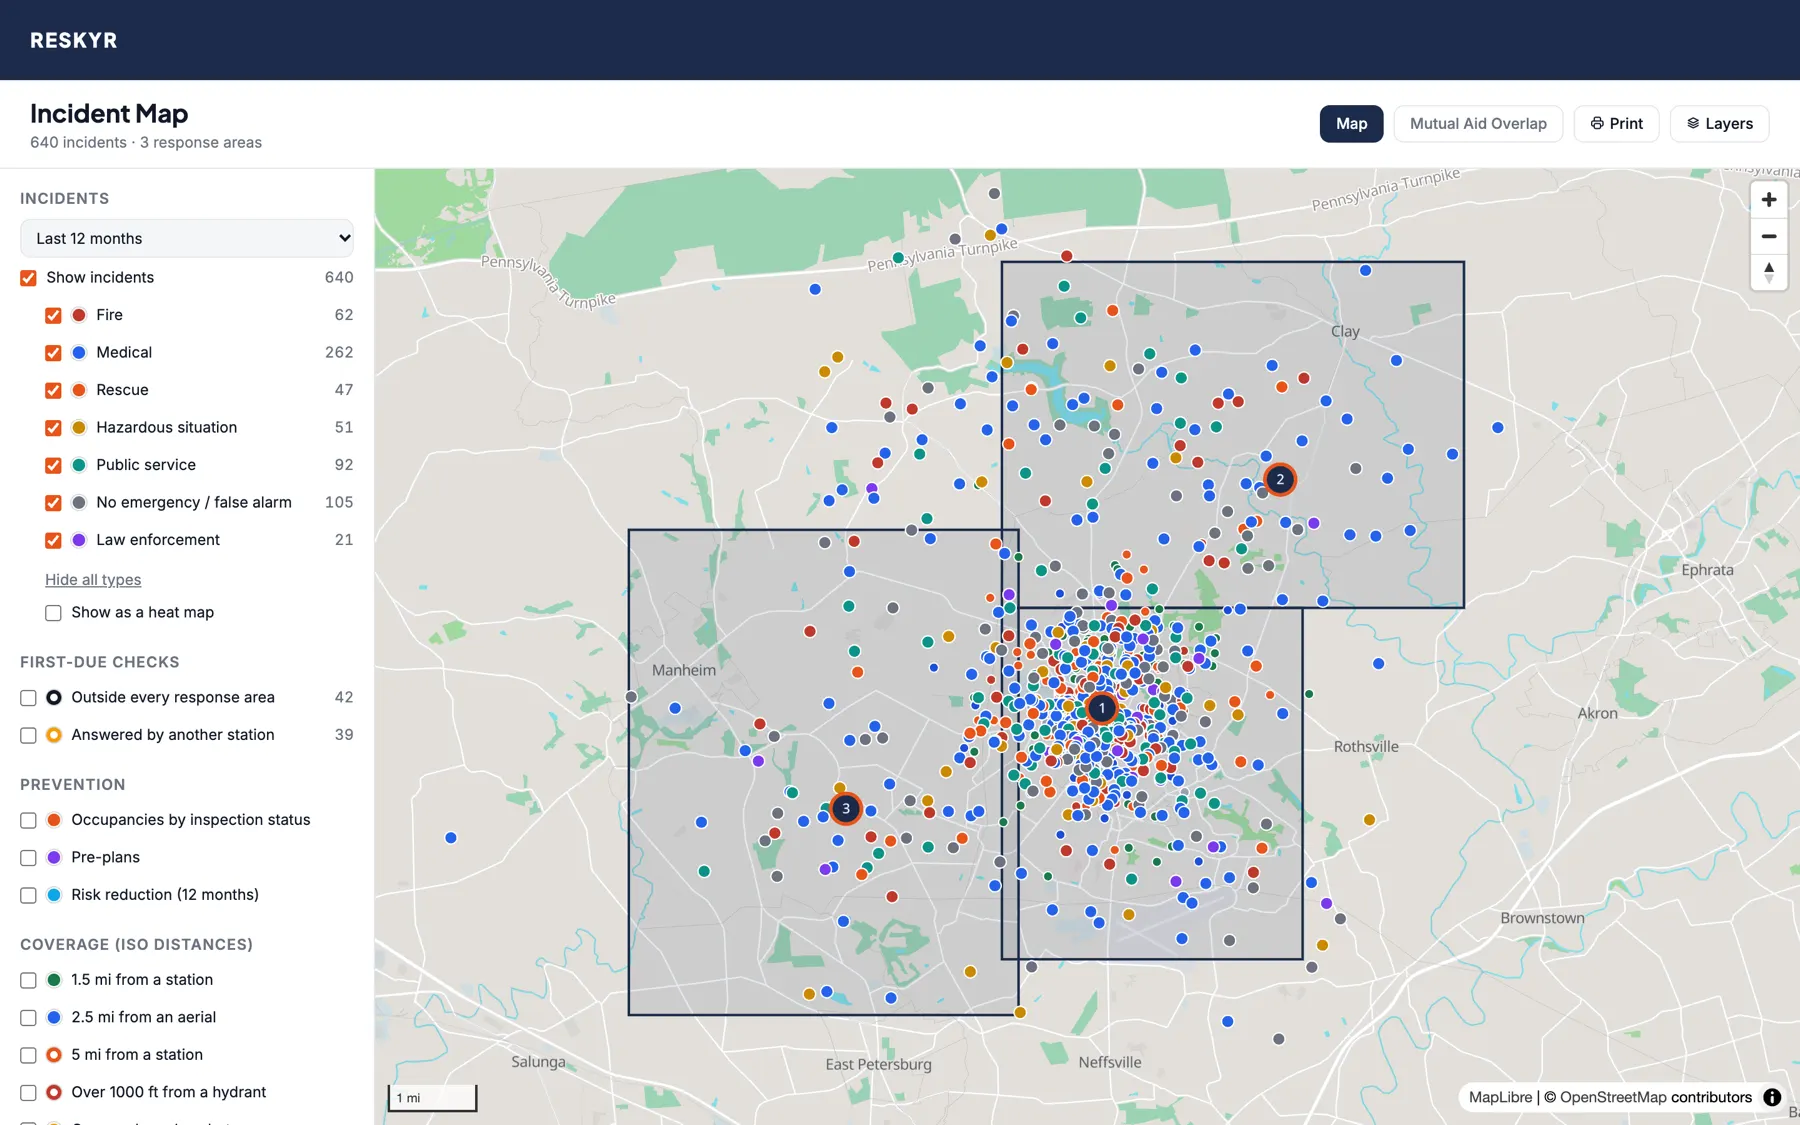
Incident map with a year of calls as dots colored by type, three stations and their response areas
A year of calls by NERIS incident type, with stations and response areas. Sample data.
Incidents

Where your calls happen, and what they are.

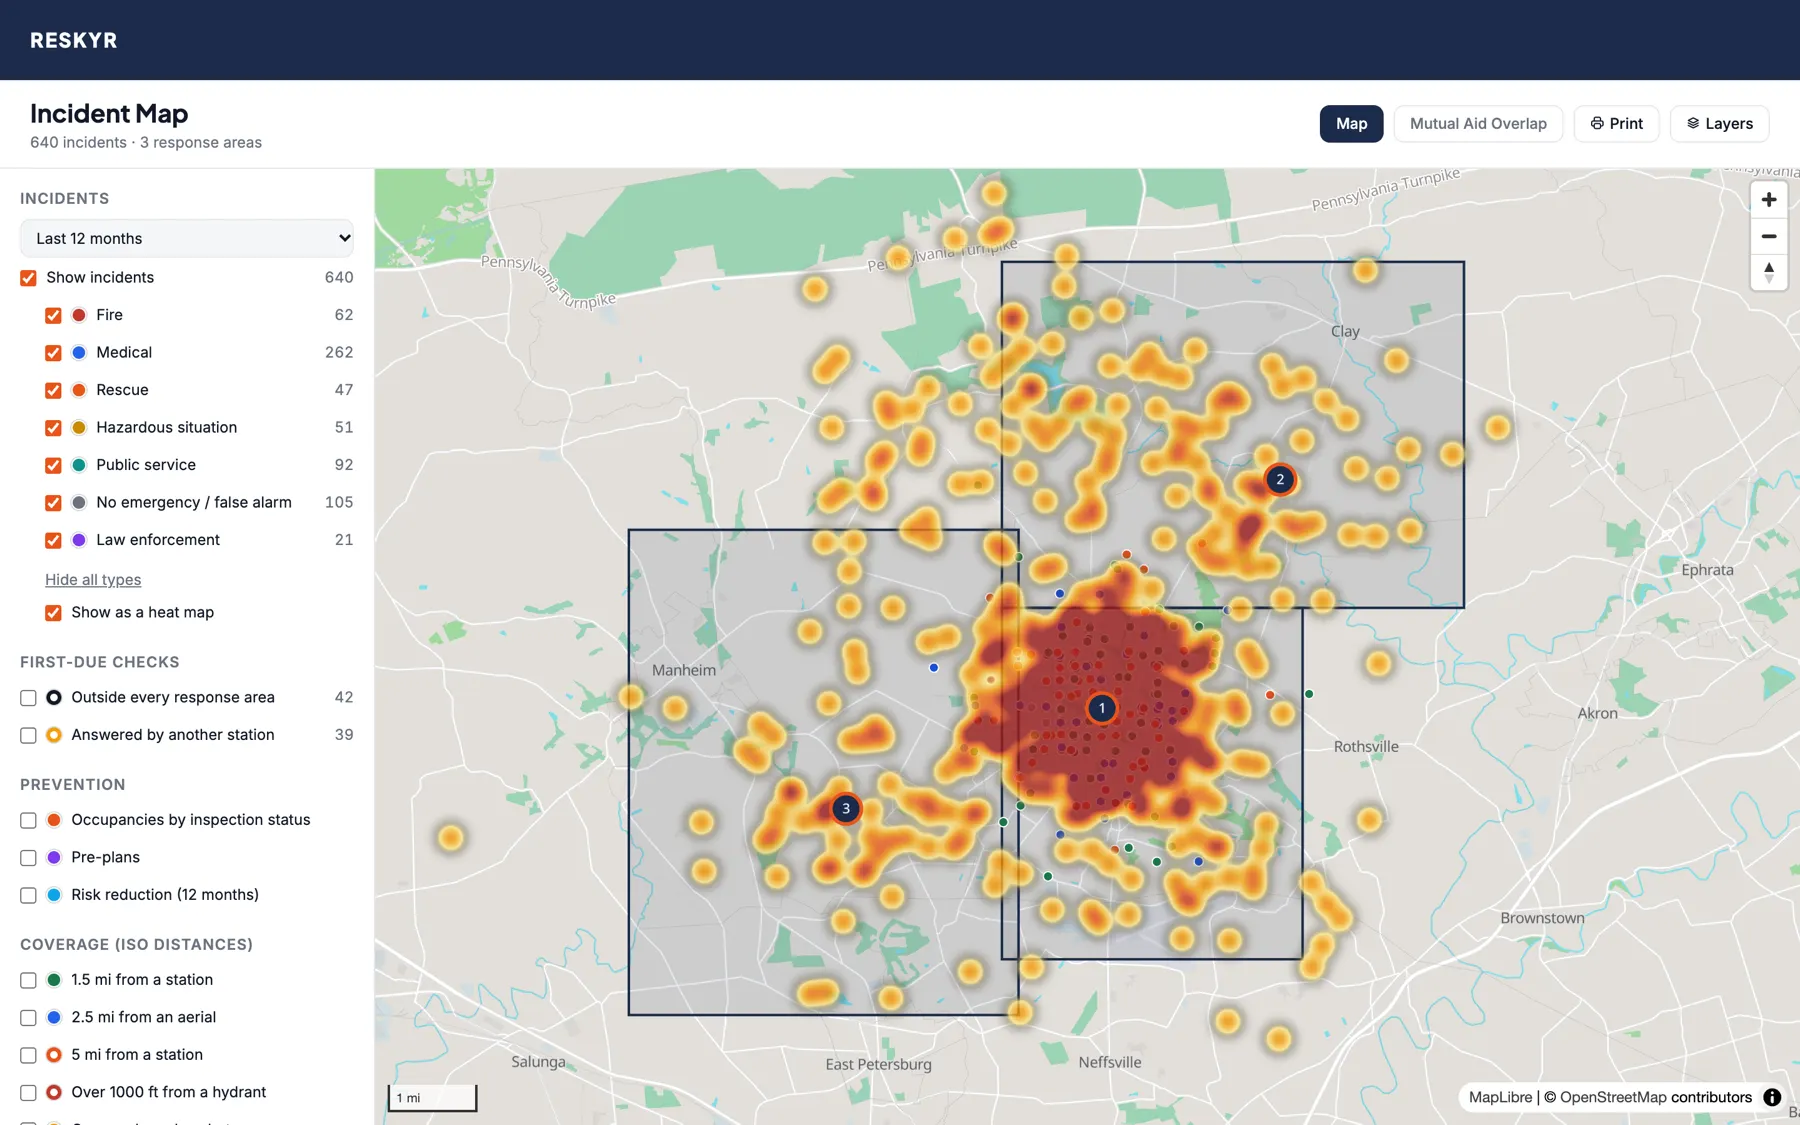
Heat map of a year of calls, darkest where calls concentrate
The same year of calls as a heat map. Sample data.

Every call, by type

  • Fire, medical, rescue, hazardous situations, public service and false alarms in their own colors
  • Click a dot for the incident number, date, type and address, and open the report
  • Test calls never appear

Placed for you

  • Pick an address from the suggestions and the call is on the map
  • Calls typed on a phone, imported or sent by dispatch without coordinates are looked up within minutes
  • Only building-level matches are used, so a dot is never dropped in the middle of town

Live units

  • Units on a call show where their tablet last reported, with the route they took
  • Active burn permits, grey while a burn ban is on
  • Hydrants colored by NFPA 291 flow class
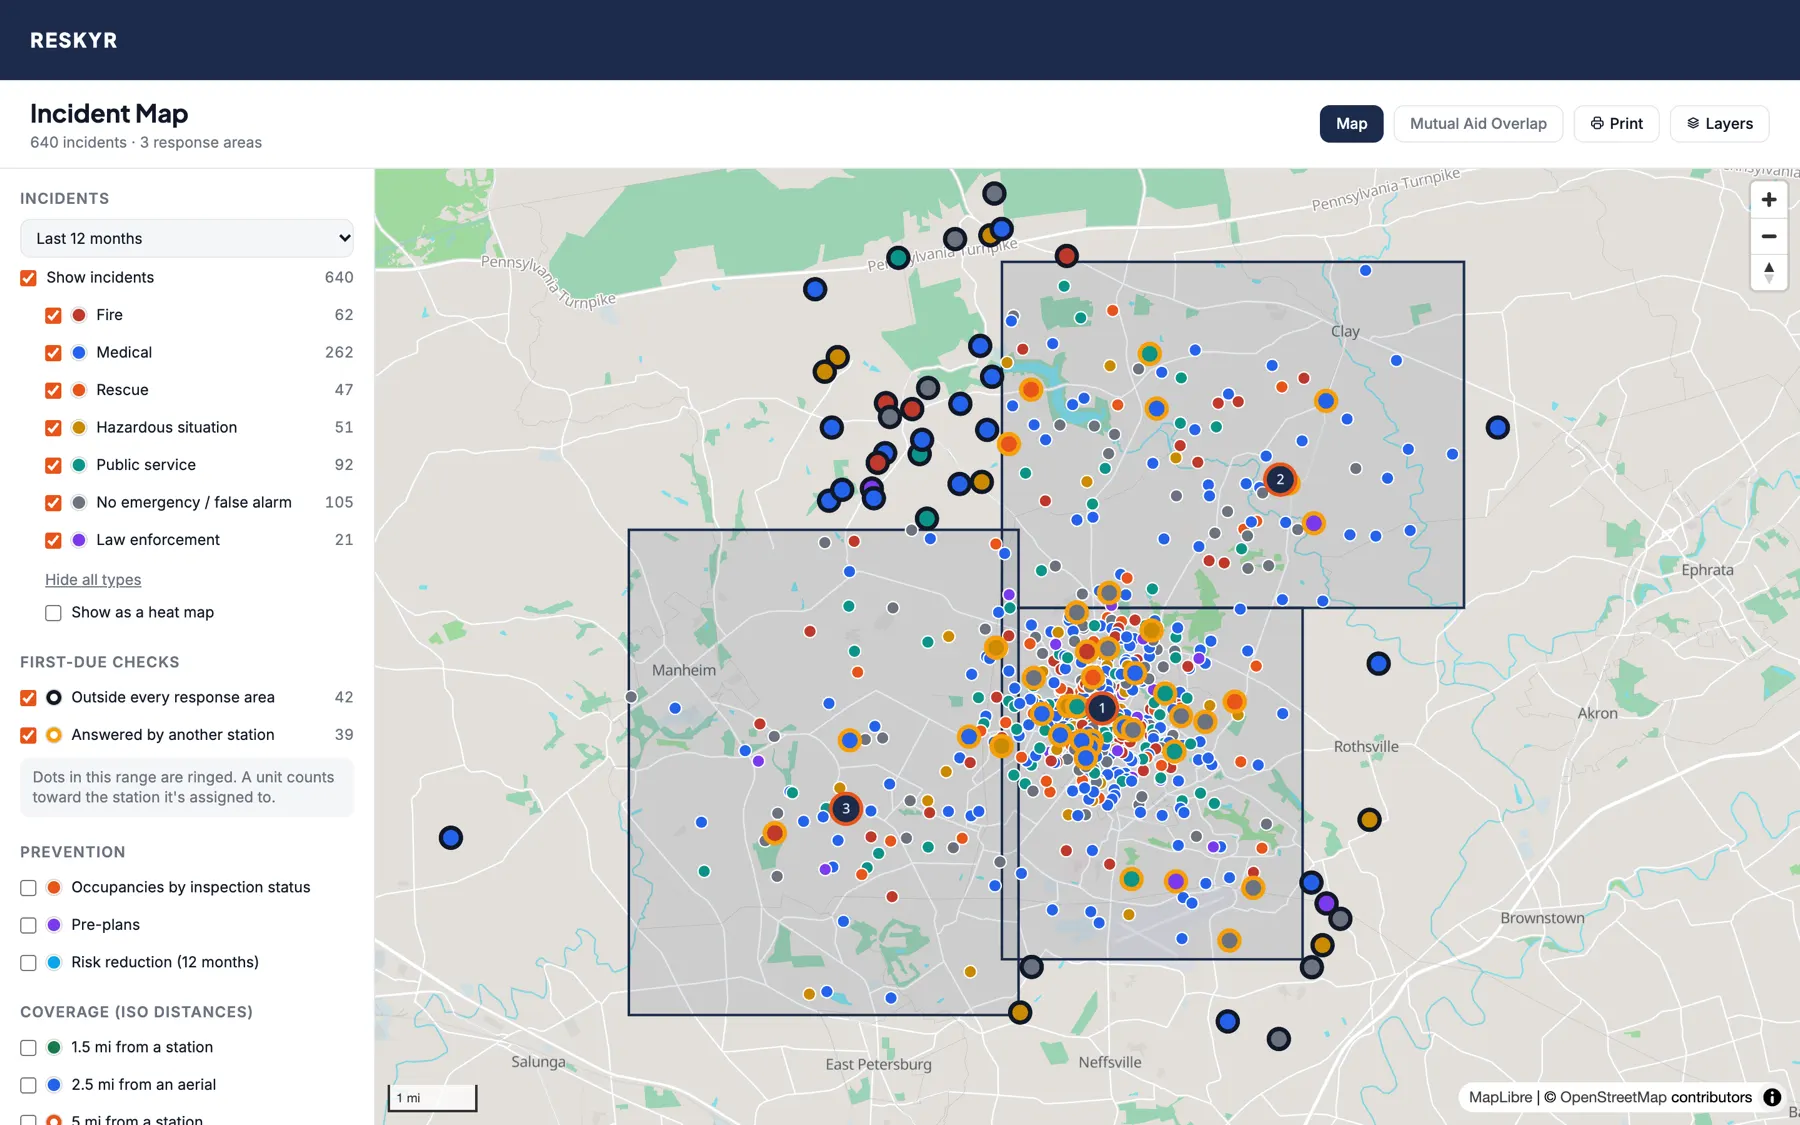
Calls ringed in black outside every response area, and in gold where another station answered
First-due checks over a year of calls. Sample data.
First due

Find the calls your response areas don't explain.

  • Draw each station's response area right on the map
  • Calls outside every area are ringed in black
  • Calls in one station's area that another station answered are ringed in gold
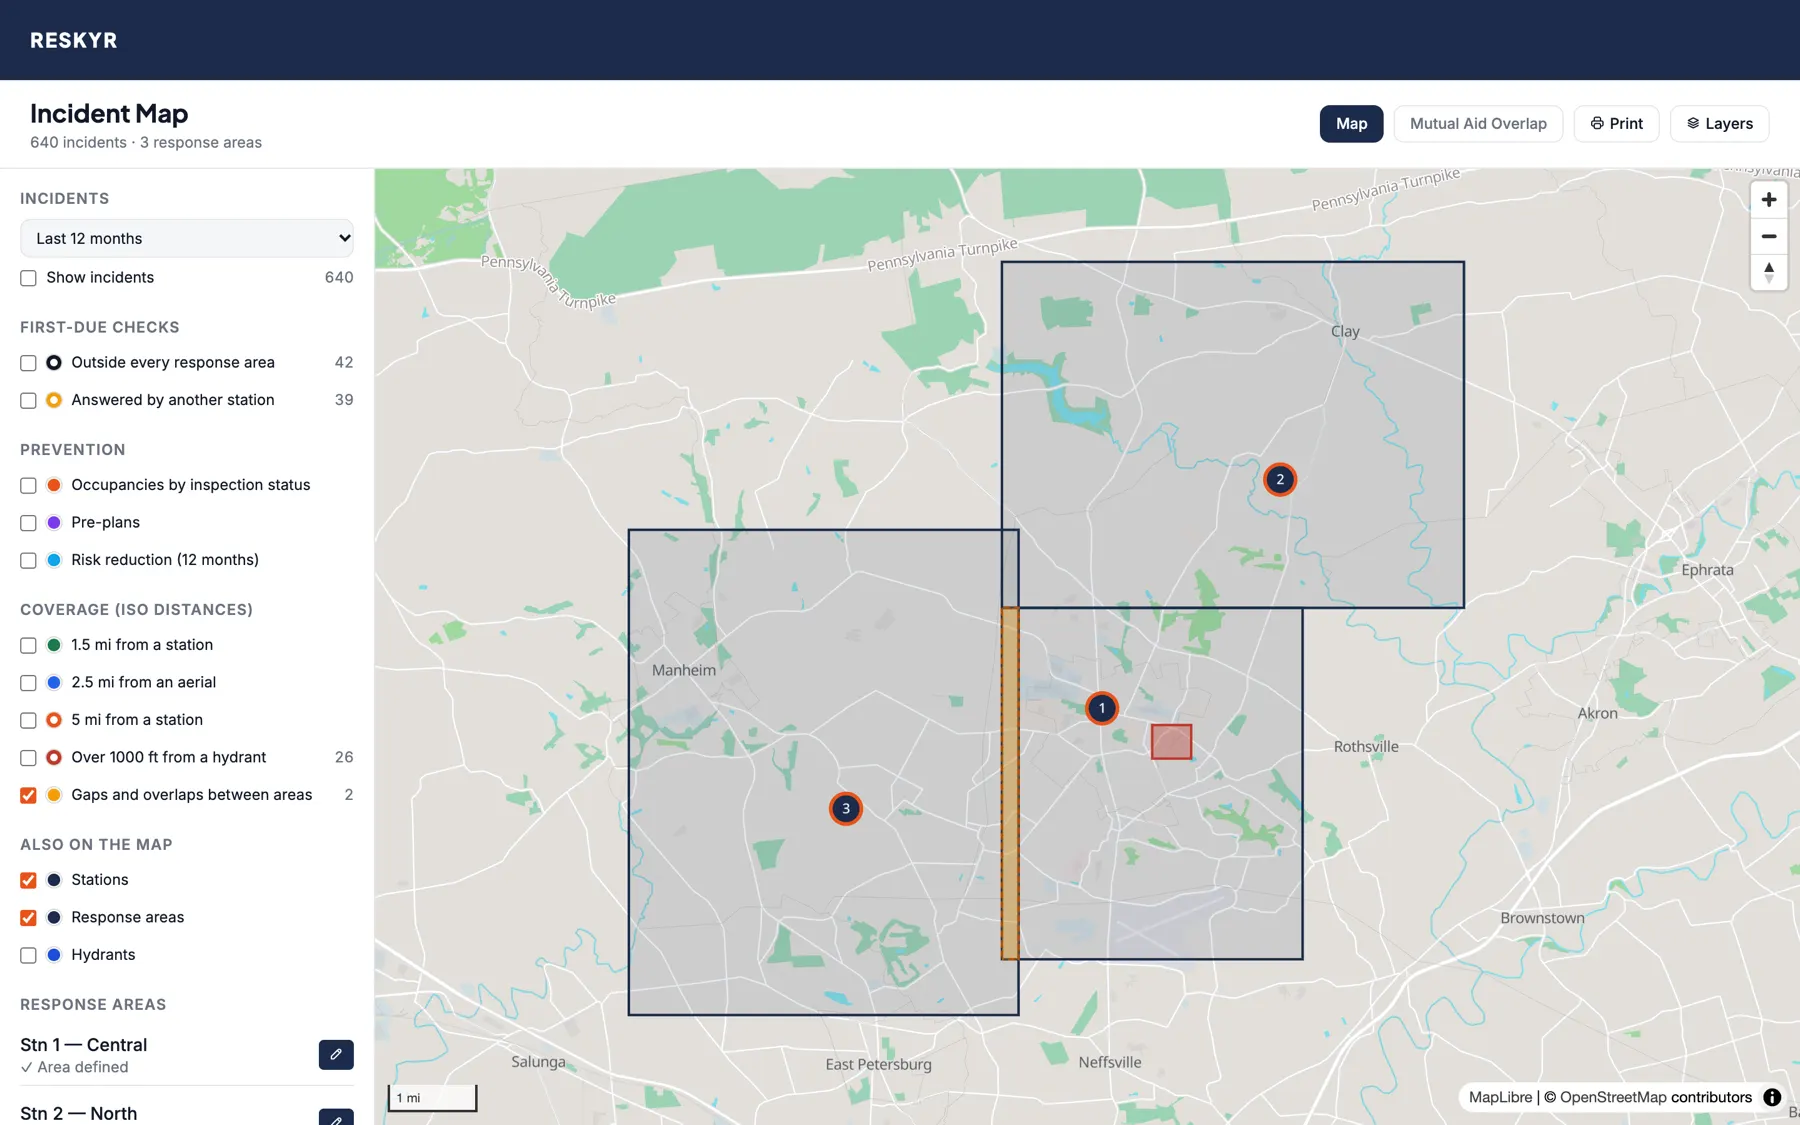
  • Ground inside your district that no station claims, and ground two stations both claim, shows in red and orange
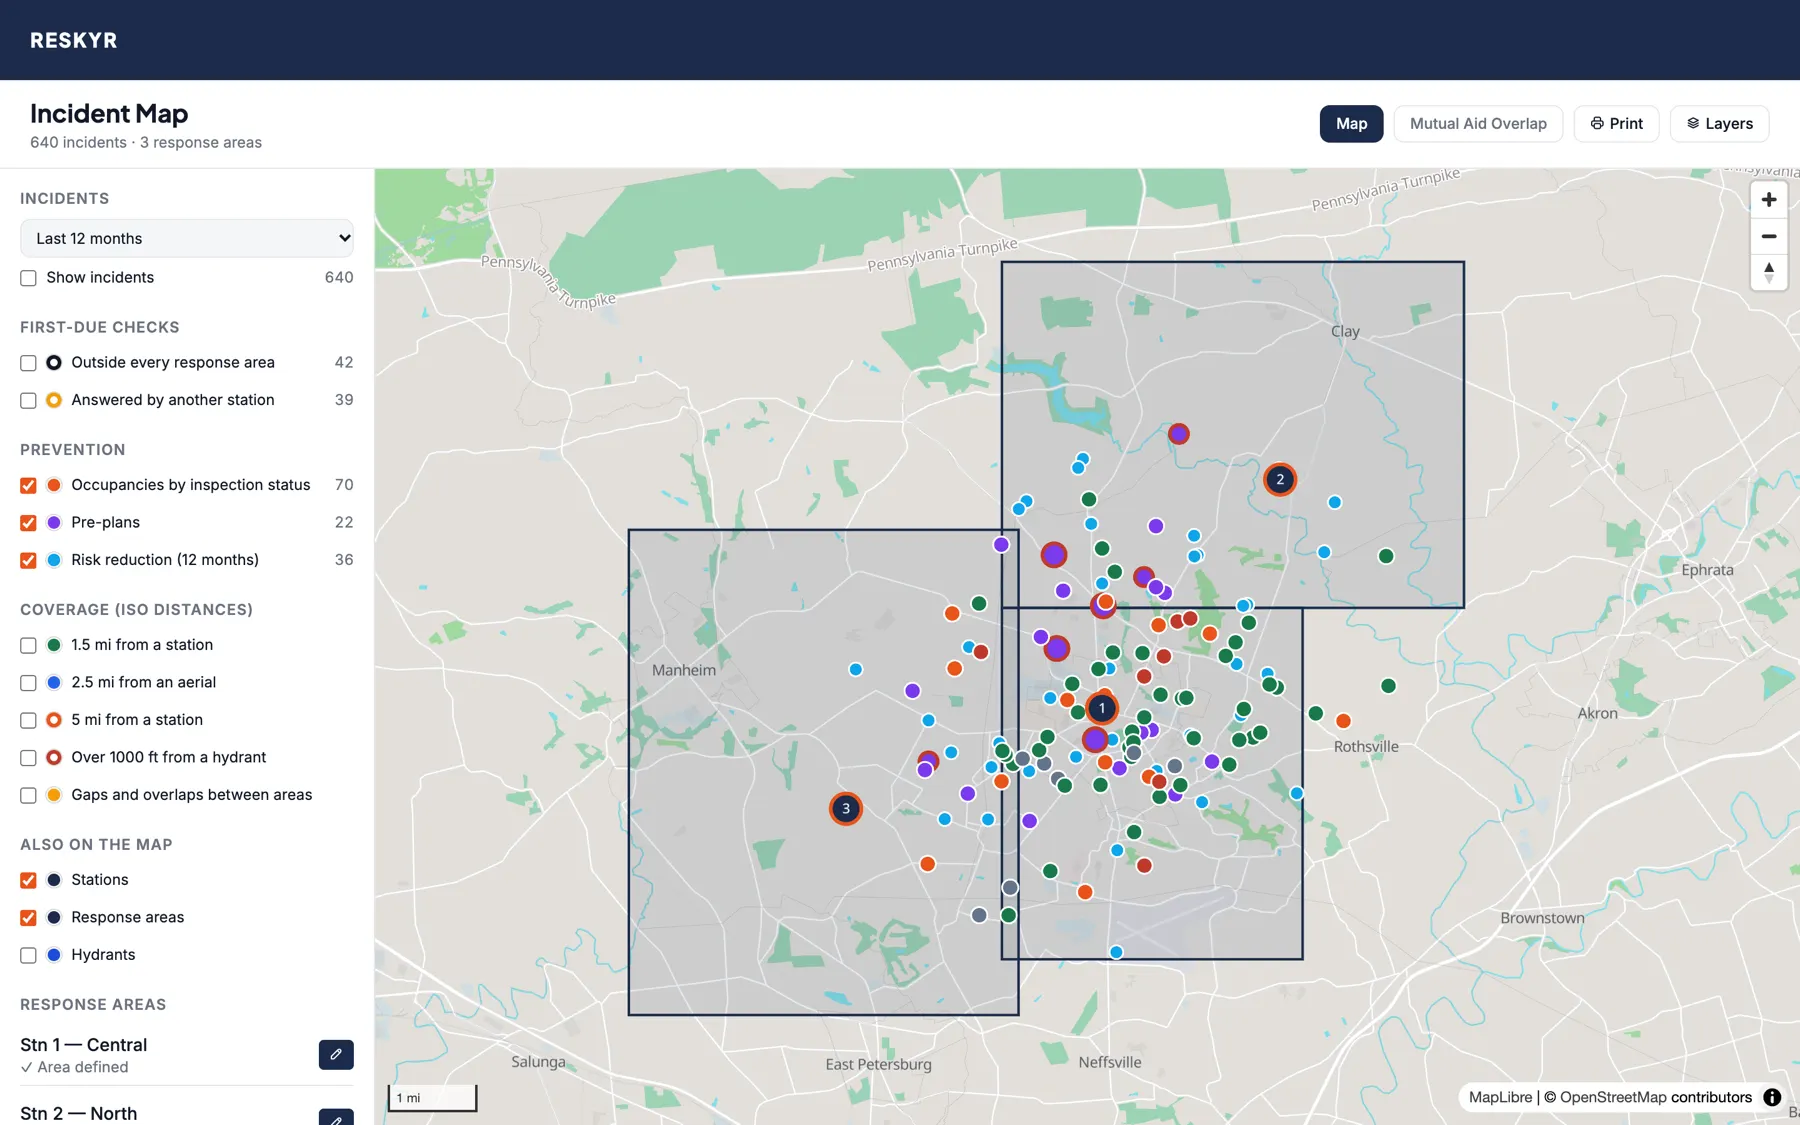
Occupancies colored by inspection status, pre-plans and risk reduction visits on the map
Occupancies, pre-plans and risk reduction visits. Sample data.
Prevention

Your inspections and pre-plans, by address.

  • Occupancies colored by status: overdue, open violations or compliant
  • Pre-plans, with target hazards and stored hazardous materials ringed in red
  • Home safety visits, smoke alarm installs and public education from the last year
  • Click any of them to open the record
Coverage

A first look at your ISO coverage, before the grading visit.

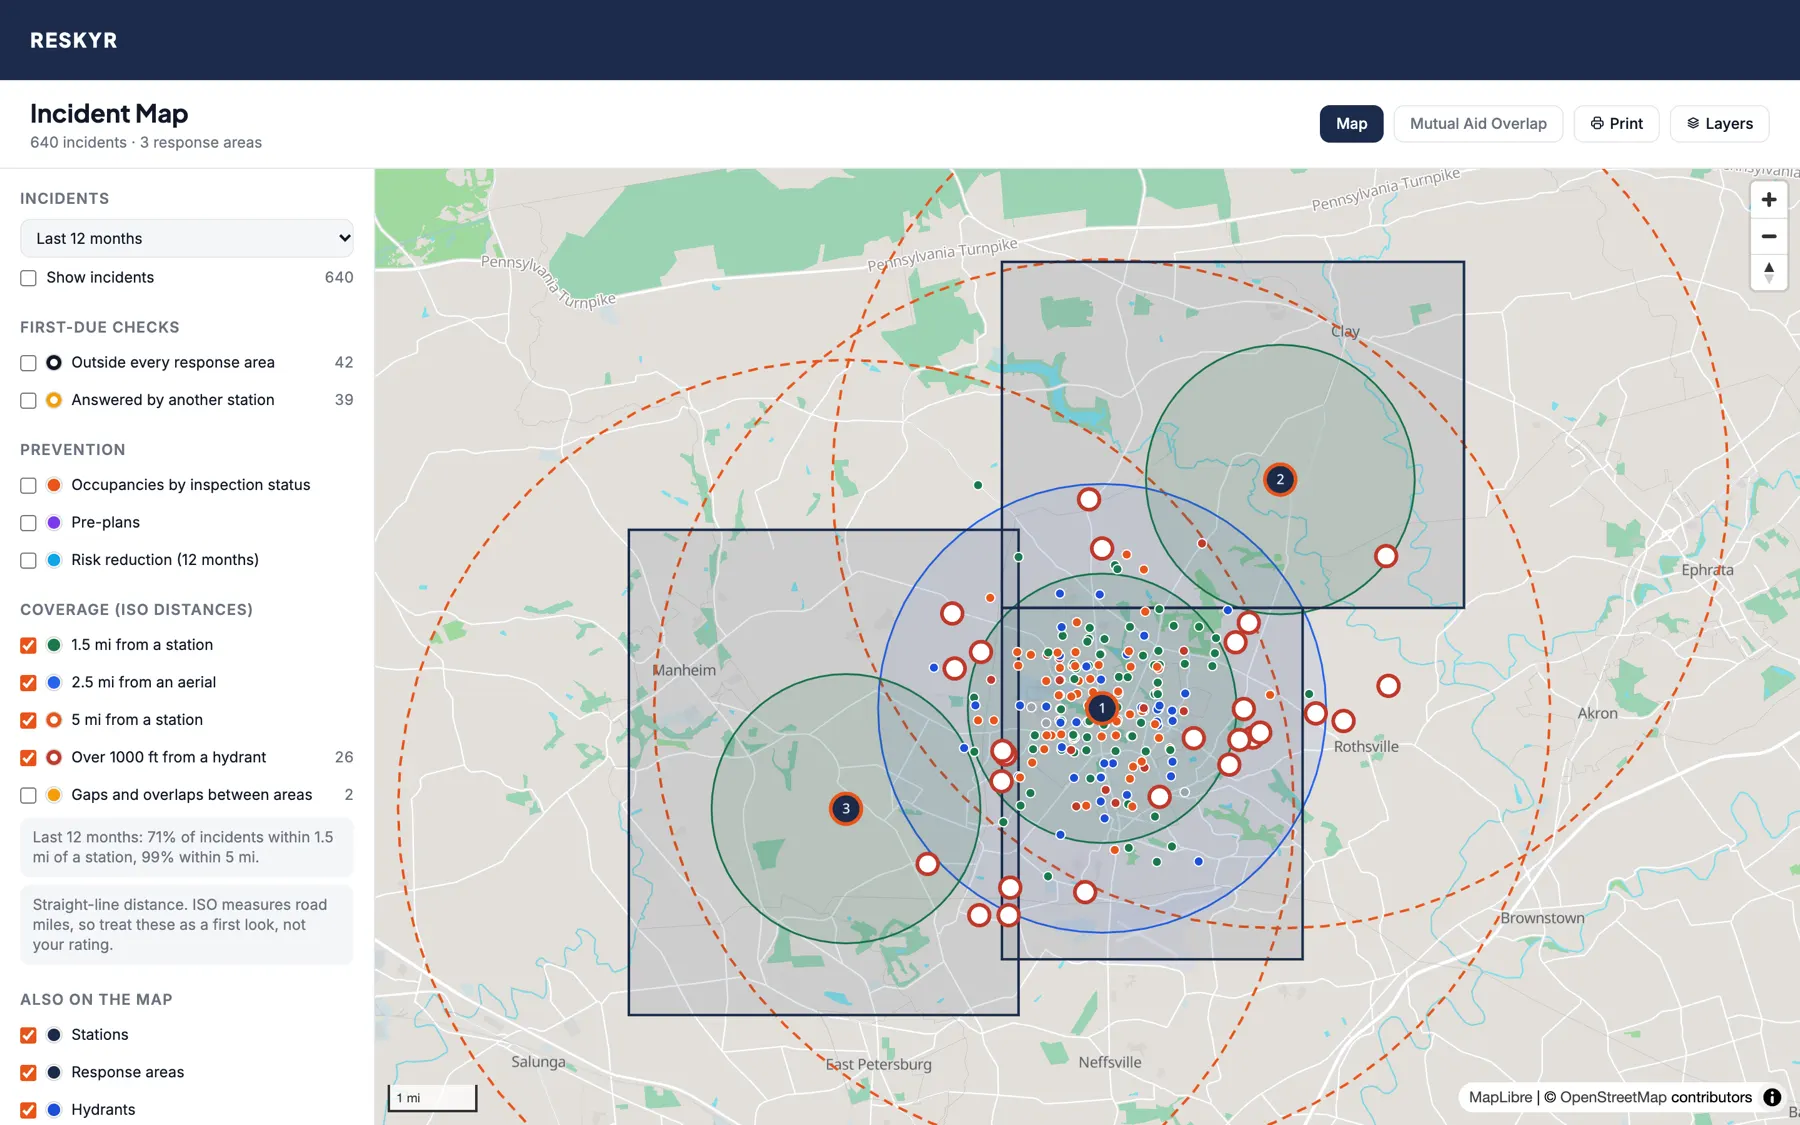
Rings at 1.5, 2.5 and 5 miles around stations, and buildings far from a hydrant ringed in red
1.5-mile engine and 2.5-mile aerial rings, the 5-mile line, and buildings over 1,000 ft from a hydrant. Sample data.
A gap between response areas in red and an overlap between two stations in orange
Gaps and overlaps between your stations' response areas. Sample data.

ISO distances

  • Rings at ISO's engine (1.5 mi) and ladder (2.5 mi) distances
  • The 5-mile line beyond which property is rated Class 10
  • The share of last year's calls within each distance

Hydrant reach

  • Occupancies and pre-plans with no in-service hydrant within 1,000 ft
  • The distance to the nearest one
  • Out-of-service hydrants don't count

Read it right

  • Distances are straight-line, and ISO measures road miles
  • Use it to find the weak spots and plan, then confirm with your ISO grading
Neighboring departments

See the departments around you, without typing them in.

Turn on two switches and the map shows every neighboring department's stations and boundaries within about 15 miles, from NERIS Public. Plan mutual aid, check who's next door, and look up a neighbor's NERIS ID in one click.
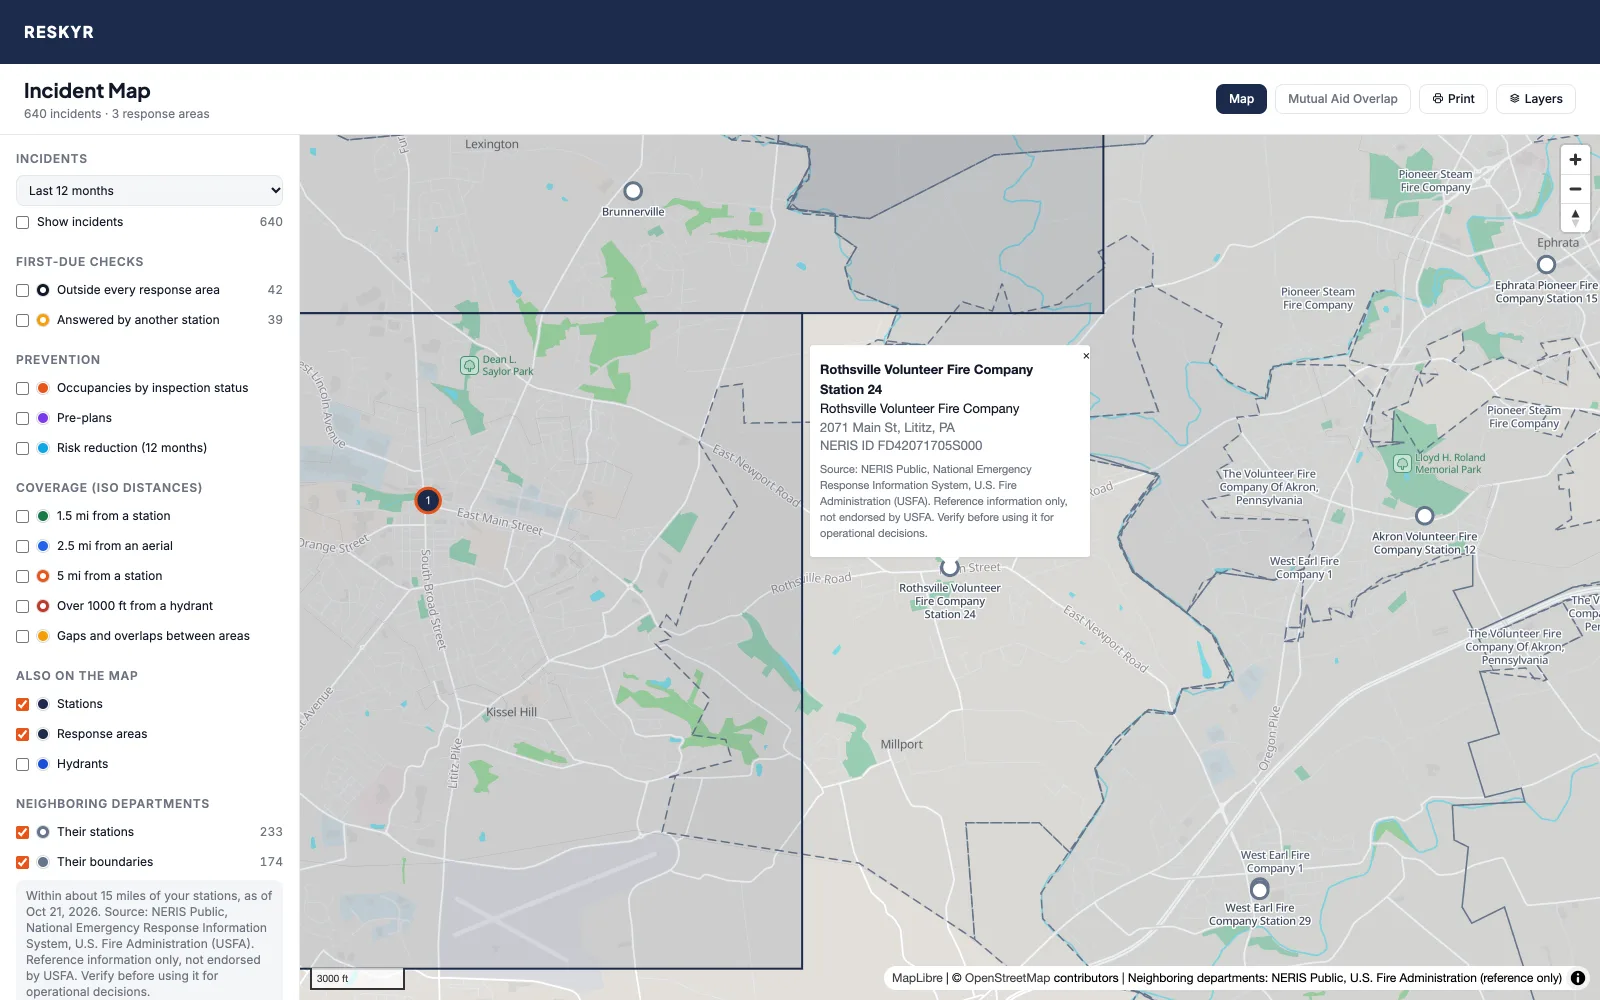
A demo department's map with its neighbors turned on. The demo department is sample data; neighboring stations and boundaries are NERIS Public data.
A neighboring station's name, department, address and NERIS ID in a popup, with the NERIS Public source line
Click a neighboring station for its department, address and NERIS ID.
  • Neighbors' stations as white dots, their boundaries as dashed outlines, under your own stations and response areas
  • Your own department is left out, so nothing doubles up
  • On the incident map and the mutual aid view, and on printed maps
  • Updated from NERIS Public every day, so a neighbor's change in NERIS shows up on your map

Source: NERIS Public, National Emergency Response Information System, U.S. Fire Administration (USFA). Used with permission. Reference information only, not endorsed by USFA. Verify before using it for operational decisions.
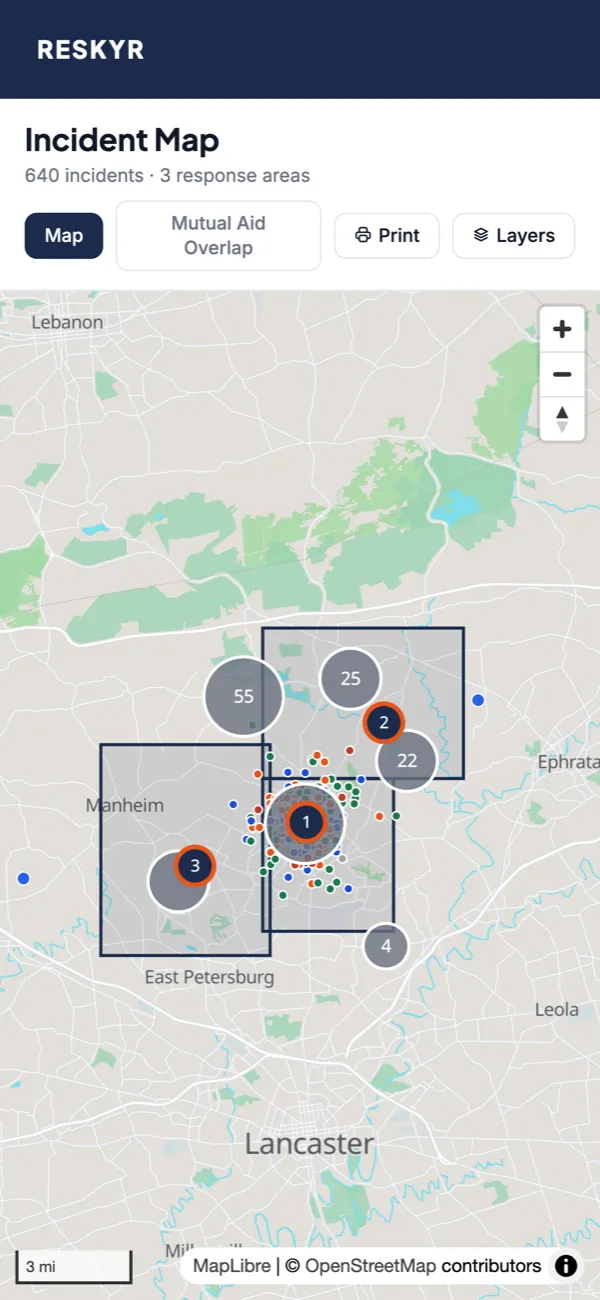

The incident map on a phone
Print, share, take it with you

On the wall at the station, or in your pocket.

  • Print the map you're looking at with its legend and date, or save it as a PDF for a board meeting or a grant
  • Share a link that opens the map with the same layers on
  • Works on a phone, with the layer switches one tap away
  • The base map is served by Reskyr from OpenStreetMap data, not loaded from Google or Mapbox

See your district on the map this week.

Add your stations, draw your response areas and watch your calls fill in. Request a trial and, once we confirm your department, get 30 days with every module. No credit card required.